Small Business Statistics (2026): 70+ Data Points on Size, Employment, Revenue, Failure, and Growth
There are 36.2 million small businesses in the United States — 99.9% of all U.S. businesses — employing 62.3 million people, generating 43.5% of GDP, and accounting for 88.9% of all net new job creation between March 2023 and March 2024. Small business is not a niche segment of the American economy. It is the economy. Yet behind the headline figures lies a more complex picture: the median small business holds just 27 days of cash buffer, 49.4% fail within five years, and cash flow problems contribute to 82% of those failures. We aggregated data from the SBA Office of Advocacy 2025 Small Business Profile, the SBA FAQ About Small Business 2026, the U.S. Census Bureau 2025 Business Owner Characteristics Release, the Bureau of Labor Statistics Business Employment Dynamics 2024, the Federal Reserve Small Business Credit Survey 2025, the Salesforce SMB Trends Report 2024, the U.S. Chamber of Commerce Empowering Small Business Report 2025, and dozens of other primary sources to give you the most comprehensive small business statistics reference available for 2026.
Try it on your next invoice
Draft from text or voice, edit every field, and export a PDF—free on the homepage.
Try AI invoiceKey Takeaways
- There are 36.2 million small businesses in the U.S. — 99.9% of all businesses — with only approximately 20,000 large enterprises (500+ employees) in existence (SBA Office of Advocacy, 2025 Small Business Profile).
- Small businesses employ 62.3 million Americans — 45.9% of the entire U.S. private sector workforce (SBA Office of Advocacy, 2025 Small Business Profile).
- Small businesses contributed 88.9% of all net new U.S. jobs between March 2023 and March 2024 — approximately 1.2 million net new positions (SBA Office of Advocacy, 2025 Small Business Profile).
- Small businesses generate 43.5% of U.S. GDP and have created 62.7% of net new jobs since 1995 (SBA Office of Advocacy, 2025).
- 20.4% of U.S. businesses fail in year one; 49.4% by year five; 65.3% by year ten (Bureau of Labor Statistics, Business Employment Dynamics 2024).
- 82% of small business failures are linked to cash flow problems (U.S. Bank study, cited in SCORE and Federal Reserve publications).
- 5.2 million new business applications were filed in 2024 — well above pre-pandemic baselines and the 5th consecutive year above 4 million (U.S. Census Bureau, Business Formation Statistics 2024).
- Women owned 14.2 million U.S. businesses in 2023 with $2.8 trillion in receipts; minority-owned businesses totaled 13 million (U.S. Census Bureau, Annual Business Survey, November 2025).
- 68% of U.S. small businesses now use AI regularly — up sharply from 48% in mid-2024; 91% of AI-using SMBs report it boosts their revenue (QuickBooks 2025; Salesforce SMB Trends Report 2024).
- 82% of all U.S. small businesses are solo ventures — one person running the entire operation (SBA Office of Advocacy 2026 FAQ).
- The median small business holds just 27 days of cash buffer — fewer than one month of operating expenses (JPMorgan Chase Institute, Cash is King).
- 97.2% of all identified U.S. exporters are small businesses, accounting for $588.4 billion (33%) of total export value (U.S. Census Bureau / SBA, Profile of U.S. Exporting Companies 2022–2023).
How Many Small Businesses Are There in the U.S.?
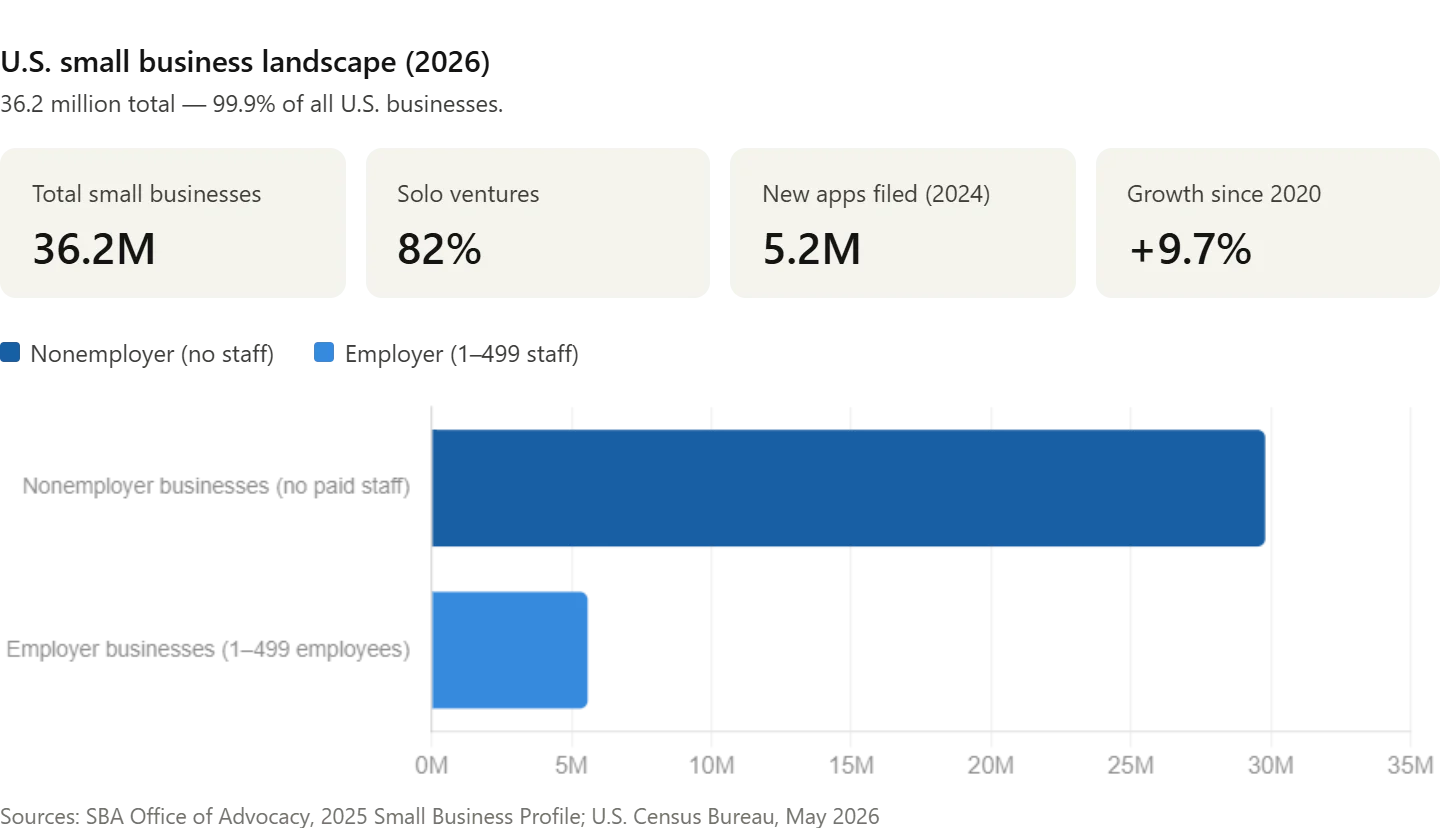
The number 36.2 million deserves unpacking. The vast majority — 29.8 million — are nonemployer businesses: sole proprietors, freelancers, independent contractors, and self-employed individuals with no paid staff. Only 6.3 million small businesses have employees on payroll. 82% of all U.S. small businesses are run by a single person. This structural reality reshapes how we think about the "small business economy" — most of it is individual operators, not shops with staff, working from home offices, running service businesses, or building side-income streams into primary careers. The 9.7% growth in total small business count since 2020 reflects both record business application surges post-pandemic and sustained high formation rates. 5.2 million new business applications were filed in 2024 alone.
| Metric | Value | Source |
|---|---|---|
| Total U.S. small businesses (2025/2026) | 36.2 million | SBA Office of Advocacy, 2025 Small Business Profile |
| Small businesses as share of all U.S. businesses | 99.9% | SBA Office of Advocacy, 2025 Small Business Profile |
| Nonemployer businesses (no paid staff) | 29.8 million | U.S. Census Bureau, Nonemployer Statistics 2022, released 2025 |
| Employer small businesses (1–499 employees) | 5.58 million (2023 data) | U.S. Census Bureau, Statistics of U.S. Businesses, May 2026 |
| Solo businesses (one person running entire operation) | 82% of all small businesses | SBA Office of Advocacy, FAQ About Small Business 2026 |
| Home-based small businesses | 60%+ of all small businesses | SBA Office of Advocacy, 2024 |
| YoY growth in small business count (2025) | +0.28% | SBA FAQ 2026; SellersCommerce analysis |
| Growth in small business count since 2020 | +9.7% | SBA Office of Advocacy, 2025 Profile |
| New business applications filed (2024) | 5.2 million | U.S. Census Bureau, Business Formation Statistics 2024 |
| New business applications filed (2023 — record) | 5.46 million | U.S. Census Bureau, Business Formation Statistics 2023 |
| Nonemployer establishments' share of all U.S. establishments | 78.4% | U.S. Census Bureau, May 2026 |
| Nonemployer establishments' total annual revenue | ~$1.8 trillion | U.S. Census Bureau, Nonemployer Statistics 2023 |
Primary source: SBA Office of Advocacy, United States 2025 Small Business Profile. Data drawn from Census Bureau Nonemployer Statistics (2022) and Statistics of U.S. Businesses (2022), released 2025. There is a standard 2–3 year reporting lag in Census business data.
Employment and Economic Impact
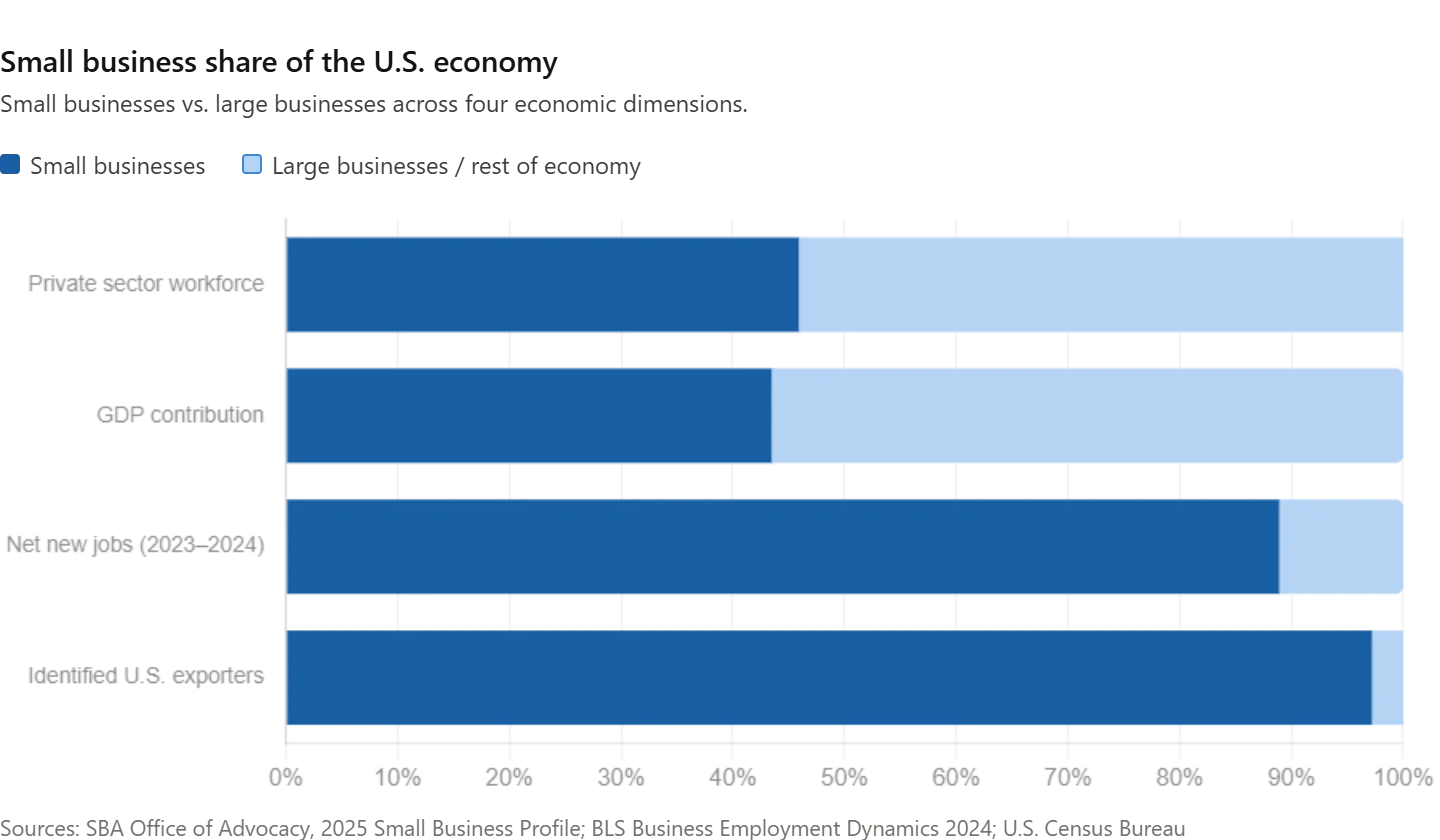
Small businesses are not a small part of the economy. They employ 45.9% of the entire U.S. private sector workforce, contribute 43.5% of GDP, and since 1995 have generated 62.7% of all net new jobs. The job creation figure from the most recent BLS period is particularly striking: between March 2023 and March 2024, small businesses added 1.2 million net new jobs — representing 88.9% of total U.S. net job creation. Large businesses, despite their scale, contributed just over 11% of that net figure. On exports, the dominance is equally clear: 97.2% of all identified U.S. exporters are small businesses, collectively shipping $588.4 billion in goods — one-third of all identified U.S. export value.
| Metric | Value | Source |
|---|---|---|
| Small business employees (total) | 62.3 million | SBA Office of Advocacy, 2025 Small Business Profile |
| Share of U.S. private sector workforce | 45.9% | SBA Office of Advocacy, 2025 Small Business Profile |
| Net new jobs created by small businesses (Mar 2023–Mar 2024) | 1.2 million | SBA Office of Advocacy, 2025 Small Business Profile |
| Share of total U.S. net job creation (Mar 2023–Mar 2024) | 88.9% | SBA Office of Advocacy, 2025 Small Business Profile |
| Net new jobs created by small businesses over 25 years | 12.9 million | Bureau of Labor Statistics, BED 2024 |
| Small business contribution to U.S. GDP | 43.5% | SBA Office of Advocacy, 2025 |
| Net new jobs created by SMBs since 1995 (share) | 62.7% | SBA Office of Advocacy, 2025 |
| Small business employment growth (1998–2022) | +13.1% | Kaplan Group citing SBA/BLS 2025 |
| Identified U.S. exporters that are small businesses | 97.2% (270,014 of 277,799) | U.S. Census Bureau / SBA, Profile of Exporting Companies 2022–2023 |
| Total small business export value | $588.4 billion (33% of identified exports) | U.S. Census Bureau / SBA, Profile of Exporting Companies 2022–2023 |
| Establishments opened (Mar 2023–Mar 2024) | 1,281,290 | SBA Office of Advocacy, 2025 Small Business Profile |
| Establishments closed (Mar 2023–Mar 2024) | 1,125,979 | SBA Office of Advocacy, 2025 Small Business Profile |
Primary sources: SBA Office of Advocacy, United States 2025 Small Business Profile and Bureau of Labor Statistics, Business Employment Dynamics. Both are primary government data series; BLS BED is the most granular and frequently updated.
Small Business Survival and Failure Rates
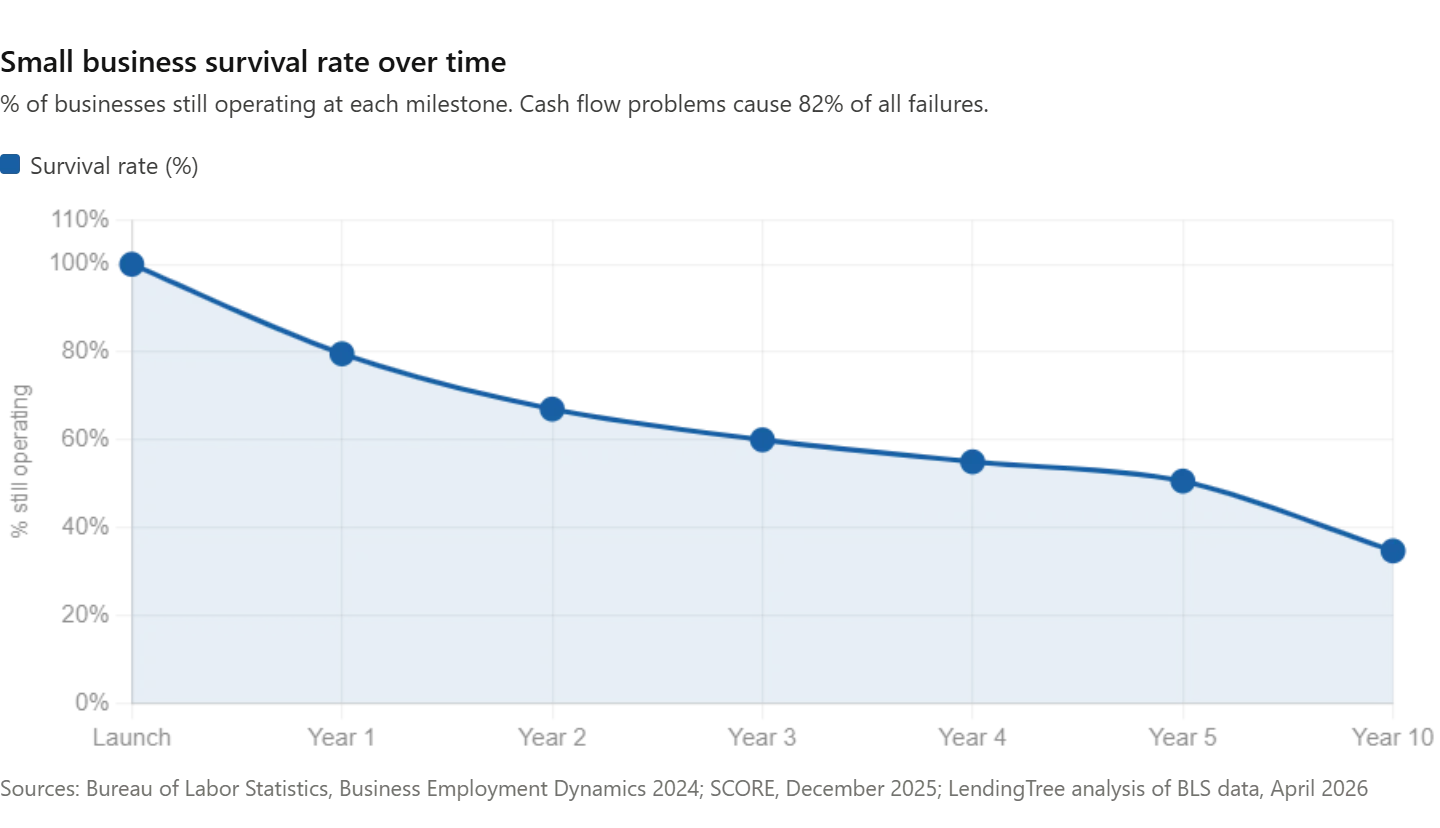
The widely shared claim that "50% of businesses fail in year one" is false. The actual BLS figure is 20.4% — still meaningful, but far from the dramatic myth. The accurate picture: 1 in 5 businesses fails in year one; 1 in 2 fails by year five; and nearly 2 in 3 have closed by year ten. The primary cause in the majority of cases is cash flow mismanagement, not lack of demand or poor strategy. The Dun & Bradstreet data adds a critical nuance: businesses experiencing cash flow gaps lasting more than 90 days are 3x more likely to seek bankruptcy protection within 18 months compared to businesses with gaps under 30 days. The gap is the killer — not the shortage itself.
| Metric | Value | Source |
|---|---|---|
| Business failure rate — year 1 | 20.4% | Bureau of Labor Statistics, BED 2024 |
| Business failure rate — year 5 | 49.4% | Bureau of Labor Statistics, BED 2024 |
| Business failure rate — year 10 | 65.3% | Bureau of Labor Statistics, BED 2024 |
| New businesses closed in latest BLS 12-month period | ~218,861 (~600/day) | LendingTree analysis of BLS BED, April 2026 |
| Highest first-year failure rate by industry | Information sector (28.4%) | LendingTree analysis of BLS BED, April 2026 |
| Strongest first-year survivor by industry | Agriculture (87.5% survive year 1) | SCORE, Small Business Failure Rates 2024, Dec 2025 |
| Primary cause of business failure | Cash flow problems (82% of failures) | U.S. Bank study, cited in SCORE/Federal Reserve |
| Businesses with 90+ day cash gaps: bankruptcy risk within 18 months | 3x more likely | Dun & Bradstreet 2025, via Crestmont Capital |
| SMBs experiencing cash flow crisis in first 3 years | More than 50% | Bluevine, Expectations vs. Reality Report, April 2026 |
| Business failure due to no market need | 42% of startup failures | CB Insights, Top Reasons Startups Fail, 2024 |
Primary source: Bureau of Labor Statistics, Business Employment Dynamics — the authoritative U.S. government dataset on business survival rates by cohort and industry. Data covers establishments opened in the year ended March 2024 still operating in March 2025.
eInvoiceGenerator's features directly address the primary failure cause: automating invoice creation and payment tracking closes the cash flow gap that ends otherwise viable businesses.
Small Business Revenue and Financing
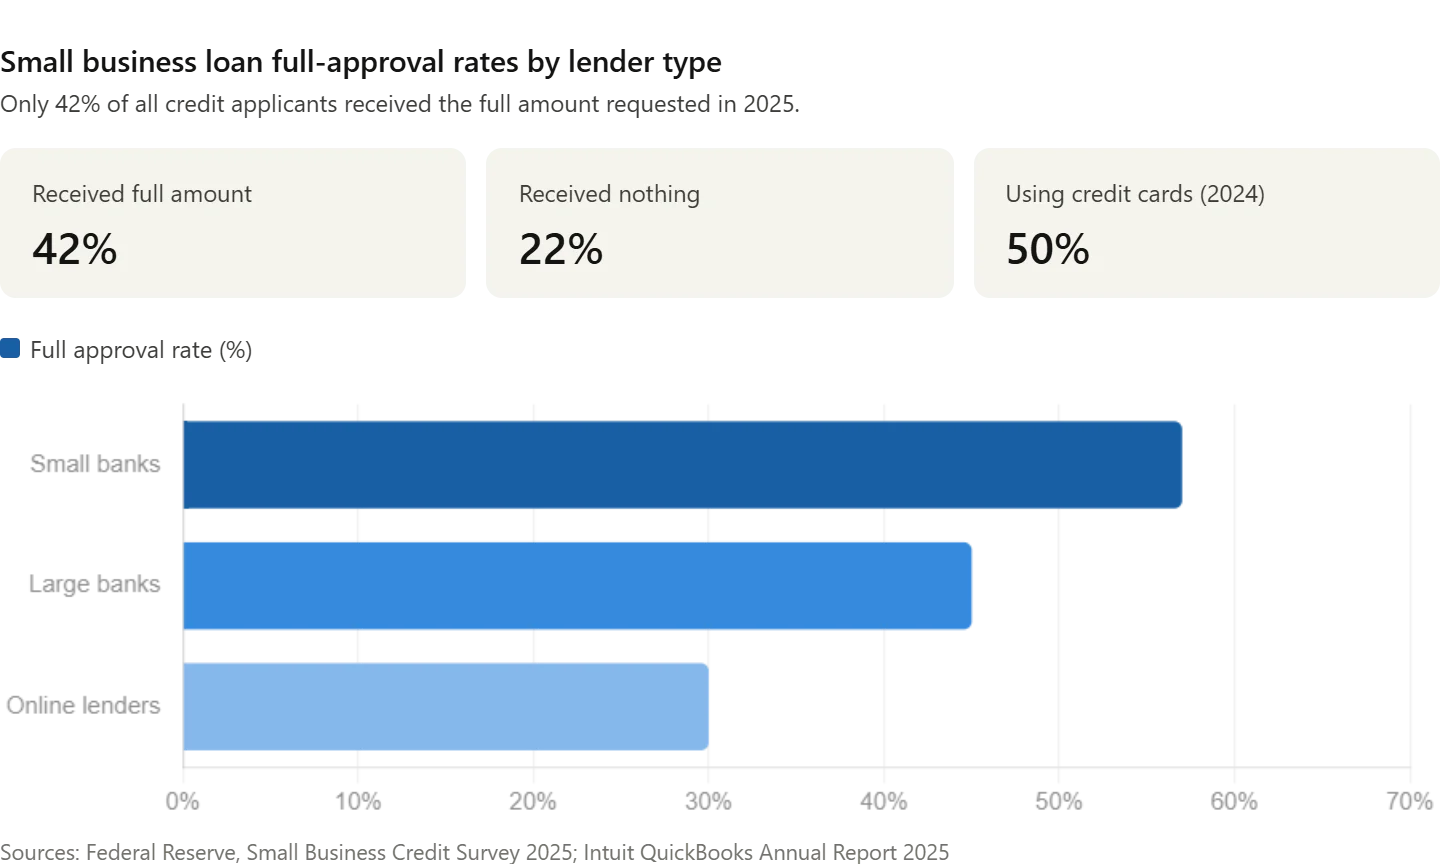
Revenue data for small businesses spans an enormous range — from a sole proprietor generating $20,000 a year to a 490-employee manufacturer generating $50 million. The average employer small business generates approximately $1.2 million annually, while the average nonemployer firm generates $44,000–$53,000. Access to financing remains one of the most persistent barriers: only 42% of small business credit applicants received the full amount requested in 2025, and 22% received nothing at all. The businesses that most need capital are systematically the least likely to receive it.
| Metric | Value | Source |
|---|---|---|
| Average employer small business annual revenue | ~$1.2 million | SBA Office of Advocacy, 2024 |
| Average nonemployer firm annual revenue | $44,000–$53,000 | U.S. Census Bureau, Nonemployer Statistics 2022, released 2025 |
| Small businesses that are profitable | 65.3% | Guidant Financial Small Business Trends 2024 |
| Small businesses generating over $1 million annually | 9% | Guidant Financial Small Business Trends 2024 |
| Founders starting with $10,000 or less | 64% | SBA, 2024 |
| Founders relying on personal savings (not investors/credit) | 78% | SBA, 2024 |
| SMB credit applicants receiving full amount (2025) | 42% | Federal Reserve, Small Business Credit Survey 2025 |
| SMB credit applicants receiving nothing (2025) | 22% | Federal Reserve, Small Business Credit Survey 2025 |
| SMBs seeking funding to meet operating expenses | 56% | Kaplan Group citing Federal Reserve/SBA 2025 |
| Average SBA loan amount (2023) | $479,685 | Lendio data, cited in Kaplan Group 2025 |
| Small businesses using credit cards for financing (July 2024) | 50% (2x the rate of July 2023) | Intuit QuickBooks Annual Report 2025 |
| Firms citing rising costs as primary financial challenge | 75% | Kaplan Group citing Philadelphia Federal Reserve 2025 |
Primary sources: Federal Reserve Small Business Credit Survey 2025 and U.S. Census Bureau Nonemployer Statistics. For revenue benchmarks, see SBA Office of Advocacy FAQs 2026.
Small Business Demographics: Who Owns America's Small Businesses
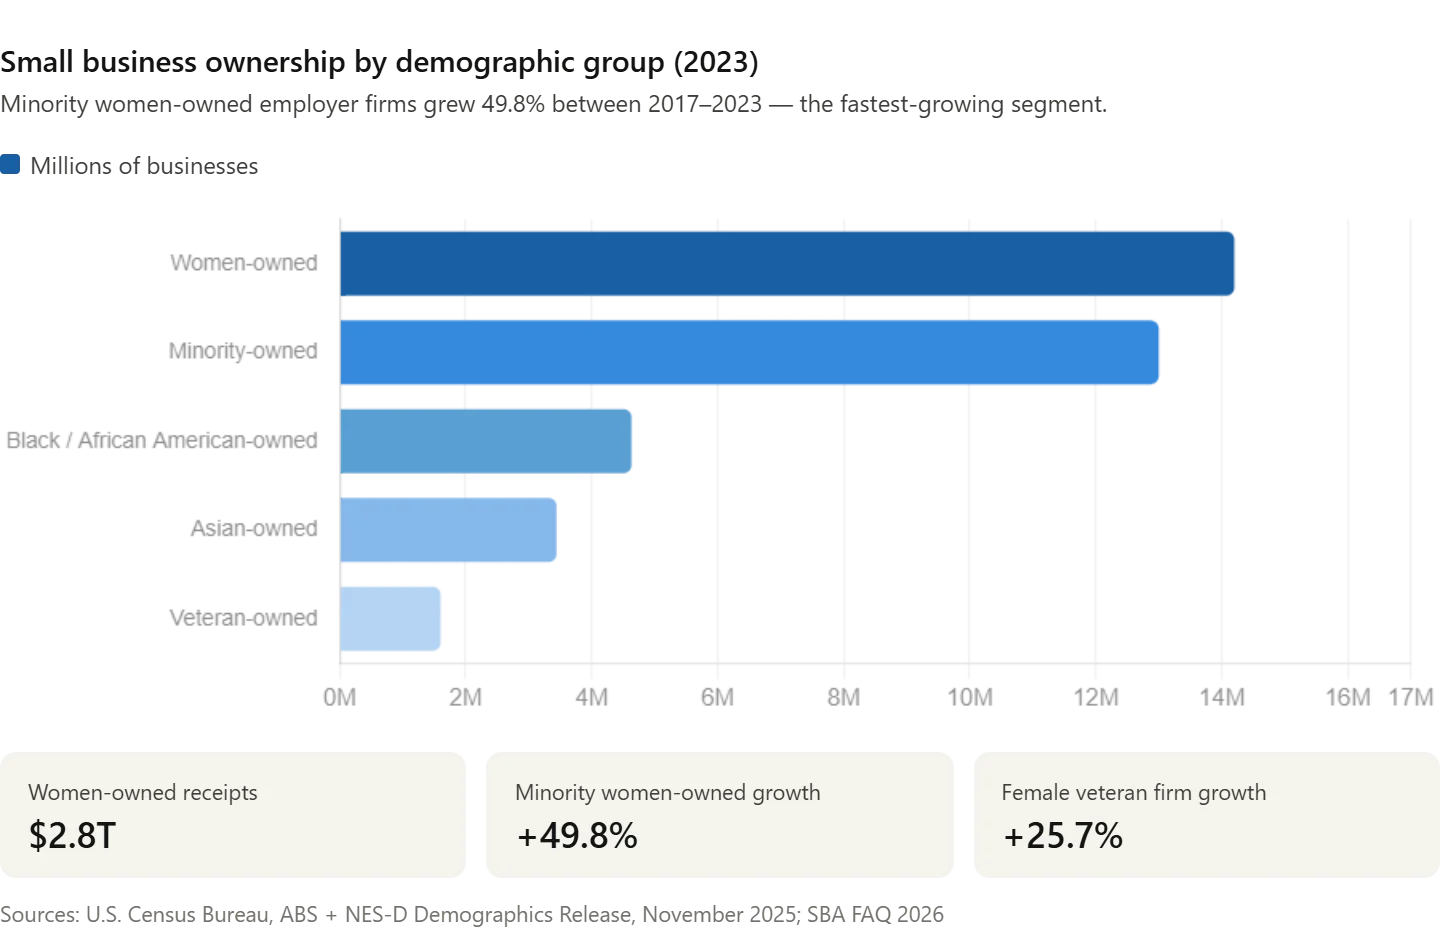
The 2025 Census Bureau release — the most comprehensive owner demographics data ever published, combining the Annual Business Survey (employer firms) and the Nonemployer Statistics by Demographics (NES-D) — gives the clearest picture yet. Women owned 14.2 million U.S. businesses in 2023 with $2.8 trillion in receipts. Minority-owned businesses totaled 13 million. Between 2017 and 2023, the number of minority women-owned employer firms grew 49.8% — the fastest-growing segment in American entrepreneurship. The gap between demographic representation in ownership versus the workforce is narrowing faster than in any previous decade.
| Metric | Value | Source |
|---|---|---|
| Total U.S. businesses (employer + nonemployer, 2023) | 36.4 million | U.S. Census Bureau, ABS + NES-D, November 2025 |
| Women-owned businesses (2023) | 14.2 million | U.S. Census Bureau, November 2025 |
| Women-owned business receipts (2023) | $2.8 trillion | U.S. Census Bureau, November 2025 |
| Women-owned employer firms | ~1.1 million | U.S. Census Bureau, Annual Business Survey, 2025 |
| Women-owned nonemployer firms | 12.7 million (43.8% of all nonemployer firms) | SBA Office of Advocacy, FAQ 2026 |
| Veteran-owned businesses (2023) | 1.6 million | U.S. Census Bureau, November 2025 |
| Minority-owned businesses (total) | 13 million | SBA FAQ 2026 |
| Minority-owned employer firms (share of all employers) | 23.5% | SBA FAQ 2026 |
| Black/African American-owned employer firms | 194,585 | U.S. Census Bureau, via Kaplan Group 2025 |
| Asian-owned employer firms | 650,680 | U.S. Census Bureau, via Kaplan Group 2025 |
| Growth in minority women-owned employer firms (2017–2023) | +49.8% | U.S. Census Bureau, May 2026 |
| Growth in female veteran-owned employer firms (2017–2023) | +25.7% | U.S. Census Bureau, May 2026 |
Primary source: U.S. Census Bureau, "Census Bureau Releases New Data About Characteristics of Employer and Nonemployer Business Owners" (November 20, 2025). This is the most comprehensive owner-demographics dataset ever published, combining Annual Business Survey employer data and NES-D nonemployer data for the first time.
Technology, AI, and Digital Adoption Among Small Businesses
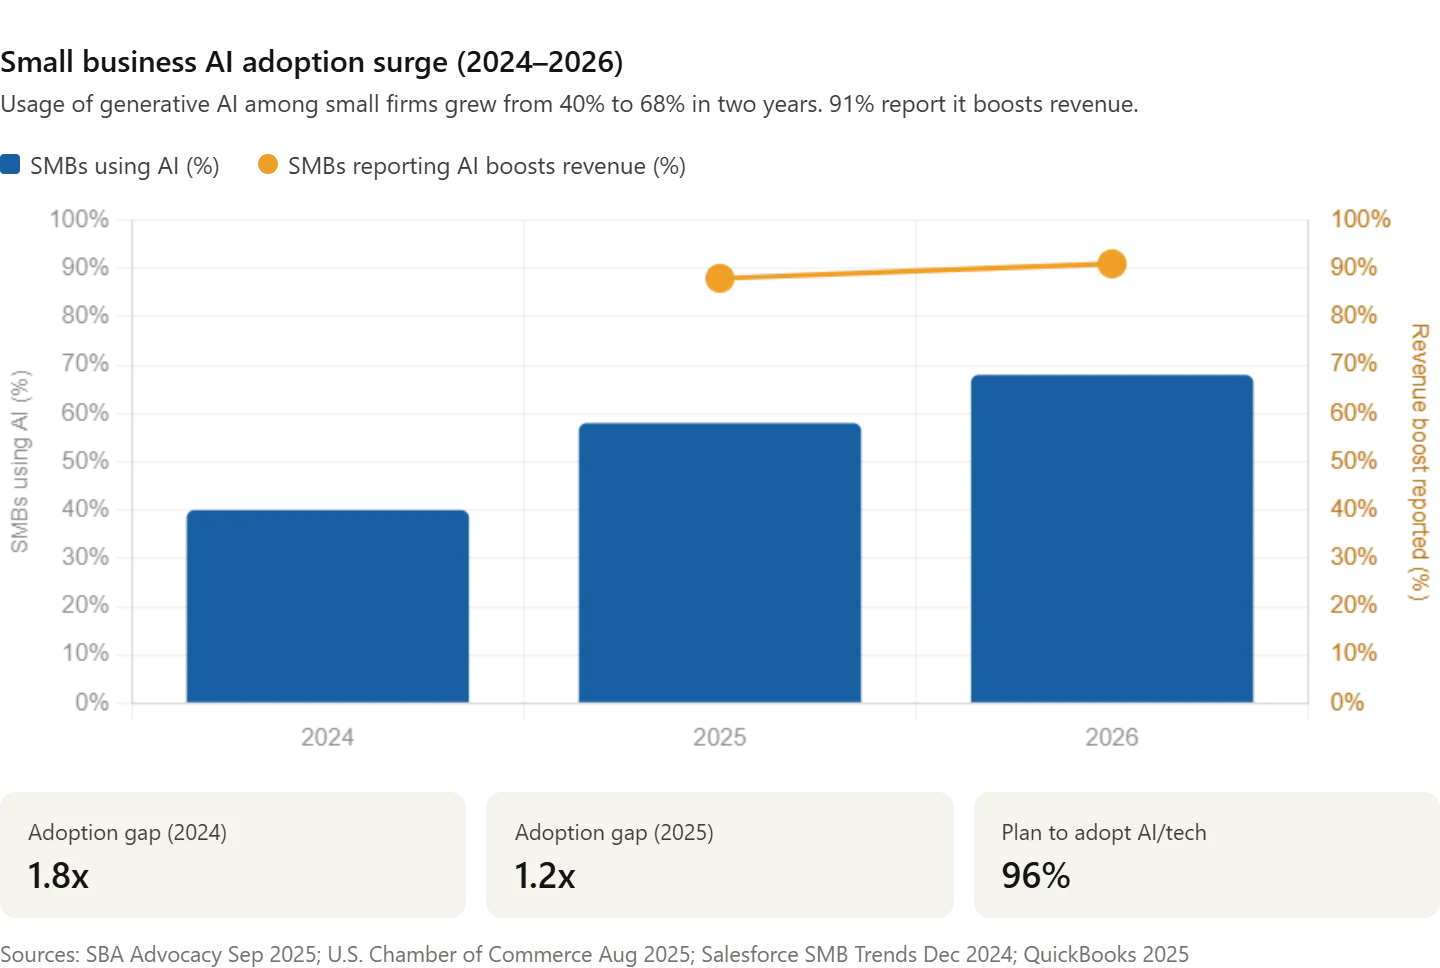
The AI adoption gap between small and large businesses is closing faster than any previous technology cycle. In February 2024, large businesses used AI at 1.8x the rate of small businesses. By August 2025 that gap had narrowed to just 1.2x — a compression that took broadband internet over a decade to achieve. 68% of U.S. small businesses now use AI regularly, and 91% of those report that it boosts revenue. The businesses that move fastest are widening their competitive advantage: small business owners who invest in AI are nearly twice as likely to report year-over-year growth compared to non-adopters.
| Metric | Value | Source |
|---|---|---|
| U.S. small businesses using AI regularly (2025/2026) | 68% | QuickBooks 2025, cited in ColorWhistle 2026 |
| SMBs using generative AI (2025) | 58% (up from 40% in 2024) | U.S. Chamber of Commerce, cited in AdAI News 2026 |
| YoY growth in SMB generative AI adoption | +41% (39% to 55% between 2024–2025) | Thryv, July 2025 |
| SMBs using AI who report it boosts revenue | 91% | Salesforce SMB Trends Report, December 2024 |
| SMBs using AI: likelihood of reporting YoY revenue growth | Nearly 2x vs. non-adopters | Salesforce SMB Trends Report, December 2024 |
| AI adoption gap: large vs. small business (Feb 2024) | 1.8x | SBA Office of Advocacy, AI in Business: Small Firms Closing In, September 2025 |
| AI adoption gap: large vs. small business (Aug 2025) | 1.2x | SBA Office of Advocacy, AI in Business: Small Firms Closing In, September 2025 |
| SMBs planning to adopt emerging tech including AI | 96% | U.S. Chamber of Commerce, Empowering Small Business Report, 2025 |
| AI-using SMBs who say AI improved competitiveness | 73% | Salesforce SMB Trends Report 2024 |
| Weekly hours saved per AI-using small business | ~8 hours/week | Upwork AI Research 2025, via MakerStations 2026 |
| SMBs using AI reporting positive overall business impact | 89% | OnDeck Small Business Trends Report, Q1 2026 |
| Top SMB AI use cases | Content marketing, customer service, invoicing/reconciliation | Salesforce SMB Trends 2024; Bluevine Expectations Report 2026 |
Primary sources: SBA Office of Advocacy, "AI in Business: Small Firms Closing In" (September 24, 2025) and U.S. Chamber of Commerce, Empowering Small Business Report (August 2025). Salesforce SMB Trends Report (n=2,500 SMB decision-makers globally, December 2024).
eInvoiceGenerator's AI invoice generation and bulk invoicing tools sit squarely in the invoicing/reconciliation use case — the category Bluevine identifies as among the most stress-causing admin tasks small business owners now automate first.
Small Business Challenges and Outlook for 2026
Optimism and anxiety are coexisting in 2026's small business data in a way that is unusual historically. 94% of small business owners project growth for 2026 — an all-time survey high — yet the NFIB Optimism Index fell to 95.8 in March 2026, below its 52-year average of 98, as oil price shocks and tariff uncertainty disrupted sentiment. Cash flow has overtaken inflation as the primary concern for the first time, cited by 31% of owners. The businesses most likely to succeed are separating themselves on two variables: speed of AI adoption and quality of cash flow management.
| Metric | Value | Source |
|---|---|---|
| Small business owners projecting growth in 2026 | 94% (all-time survey high) | Wave Connect citing OnDeck/Ocrolus, Q4 2025 |
| Owners anticipating revenue increases (2026) | 79% | Wave Connect citing OnDeck/Ocrolus, Q4 2025 |
| NFIB Small Business Optimism Index (March 2026) | 95.8 (below 52-yr avg. of 98) | NFIB, Small Business Optimism Index, March 2026 |
| Owners citing cash flow as top concern (Q1 2026) | 31% (surpassing inflation at 29%) | OnDeck Small Business Trends, Q1 2026 |
| Top challenges per NFIB (April 2026) | Labor quality (18%), taxes (17%), inflation (16%) | NFIB April 2026 Survey, cited in 99 Coupons 2026 |
| SMBs on track to meet/exceed 2026 projections | 68% | OnDeck Small Business Trends, Q1 2026 |
| SMBs planning to increase headcount in next 6 months | 38% | OnDeck Small Business Trends, Q1 2026 |
| SMBs planning capital expenditures in 2026 (avg. $109,000) | 57% | Comerica Small Business Pulse Index 2025, cited in Wave Connect |
| SMBs reporting difficulty reaching customers/growing sales | 57% (up from 53% in 2023) | Kaplan Group citing Philadelphia Federal Reserve 2025 |
| Small business owners who lose sleep over financial stress | 2 in 3 | Bluevine Financial Stress Survey, May 2026 |
Primary sources: NFIB Small Business Optimism Index (monthly survey, 52-year historical dataset) and OnDeck Small Business Cash Flow Trend Report Q1 2026 (quarterly Ocrolus cash flow platform data + Federal Reserve SBCS 2025).
Small Business Statistics by the Numbers: Summary Table
| Theme | Metric | Value | Source |
|---|---|---|---|
| Scale | Total U.S. small businesses | 36.2 million | SBA 2025 Profile |
| Scale | Share of all U.S. businesses | 99.9% | SBA 2025 Profile |
| Scale | Solo ventures (single operator) | 82% | SBA FAQ 2026 |
| Scale | New business applications (2024) | 5.2 million | Census Bureau BFS 2024 |
| Employment | Small business employees | 62.3 million | SBA 2025 Profile |
| Employment | Share of private sector workforce | 45.9% | SBA 2025 Profile |
| Employment | Share of net new job creation (2023–2024) | 88.9% | SBA 2025 Profile |
| Economic Impact | GDP contribution | 43.5% | SBA Office of Advocacy 2025 |
| Economic Impact | Share of net new jobs since 1995 | 62.7% | SBA Office of Advocacy 2025 |
| Economic Impact | Share of identified U.S. exporters | 97.2% | Census/SBA Exporting Profile 2022–2023 |
| Survival | Fail by year 1 | 20.4% | BLS BED 2024 |
| Survival | Fail by year 5 | 49.4% | BLS BED 2024 |
| Survival | Fail by year 10 | 65.3% | BLS BED 2024 |
| Survival | Primary cause of failure | Cash flow (82%) | U.S. Bank/SCORE |
| Revenue | Average employer SMB annual revenue | ~$1.2 million | SBA Office of Advocacy 2024 |
| Revenue | Credit applicants receiving full amount | 42% | Federal Reserve SBCS 2025 |
| Demographics | Women-owned businesses | 14.2 million | Census Bureau Nov 2025 |
| Demographics | Minority-owned businesses | 13 million | SBA FAQ 2026 |
| Demographics | Minority women-owned employer firm growth (2017–2023) | +49.8% | Census Bureau May 2026 |
| Technology | SMBs using AI regularly | 68% | QuickBooks 2025 |
| Technology | SMBs using AI: revenue boost reported | 91% | Salesforce SMB Trends 2024 |
| Technology | AI adoption gap (large vs. small, 2025) | 1.2x (down from 1.8x in 2024) | SBA Advocacy, Sep 2025 |
| Outlook | SMBs projecting growth in 2026 | 94% (all-time high) | OnDeck/Ocrolus Q4 2025 |
| Outlook | NFIB Optimism Index (March 2026) | 95.8 (below 52-yr avg.) | NFIB March 2026 |
| Outlook | Cash flow as #1 concern (Q1 2026) | 31% of owners | OnDeck Q1 2026 |
Methodology and Sources
This article was compiled exclusively from primary government datasets, named academic and industry surveys, and Tier 2 research aggregators that explicitly cite their underlying primary source. No statistics were reproduced from secondary blogs without tracing to an original study.
Primary Sources Used:
- SBA Office of Advocacy — United States 2025 Small Business Profile (June 2025). Annual profile drawing from Census Bureau SUSB and NES data through 2022–2024 reporting cycles.
- SBA Office of Advocacy — Frequently Asked Questions About Small Business 2026 (January 2026). Official headline figures on firm count, employment share, and GDP contribution.
- SBA Office of Advocacy — AI in Business: Small Firms Closing In (September 24, 2025). Longitudinal AI adoption analysis comparing small vs. large business usage rates.
- U.S. Census Bureau — "Census Bureau Data Tell the Small Business Story" (May 2026). Small Business Week data release, covering 2023 employer and nonemployer establishment counts.
- U.S. Census Bureau — "Census Bureau Releases New Data About Characteristics of Employer and Nonemployer Business Owners" (November 20, 2025). First-ever combined ABS + NES-D demographics release.
- U.S. Census Bureau — Nonemployer Statistics (NES) (2022, released 2025). Official nonemployer establishment count and receipts.
- U.S. Census Bureau — Business Formation Statistics (2024). High-frequency data on new business applications.
- Bureau of Labor Statistics — Business Employment Dynamics 2024. Official U.S. business survival rates by age cohort and industry.
- Bureau of Labor Statistics — "Small Businesses Contributed 55% of Total Net Job Creation from 2013 to 2023" (2024).
- Federal Reserve — Small Business Credit Survey 2025. Annual survey covering all 50 U.S. states; published early 2026.
- JPMorgan Chase Institute — "Cash is King: Flows, Balances, and Buffer Days". Transaction analysis of 470 million transactions across 597,000 small businesses.
- Salesforce — SMB Trends Report, December 2024. Survey of 2,500 SMB decision-makers globally on AI adoption, revenue impact, and challenges.
- U.S. Chamber of Commerce — Empowering Small Business: The Impact of Technology on U.S. Small Business (August 13, 2025). Technology and AI adoption intent survey.
- Bluevine — Payment Gap Report (March 24, 2026). Survey of 1,052 U.S. SMB owners. Margin of error ±3%, 95% confidence.
- Bluevine — Small Business Expectations vs. Reality Report (April 21, 2026). Survey of 785 U.S. SMB owners by Centiment.
- Bluevine — Financial Stress Survey (May 2026). Survey of 781 U.S. SMB owners.
- Intuit QuickBooks — Small Business Index Annual Report 2026 (January 2026). Monthly index tracking employment and revenue trends.
- NFIB — Small Business Optimism Index (monthly). 52-year benchmark survey of U.S. small business economic conditions.
- OnDeck — Small Business Cash Flow Trend Report, Q1 2026. Quarterly Ocrolus cash flow data + Federal Reserve SBCS 2025.
- CB Insights — Top Reasons Startups Fail (2024 update). Post-mortem analysis of 100+ startup failures.
- LendingTree — Small Business Failure Rate Analysis (April 2026). Primary analysis of BLS Business Employment Dynamics data.
- Guidant Financial — 2026 Small Business Trends Report. Annual survey of U.S. small business owners on demographics, revenue, and funding.
Last updated: May 2026. We update this page quarterly to reflect new SBA profiles, Census Bureau releases, and Federal Reserve survey waves.
All statistics are cited inline at point of use. If you find a conflicting or more recent primary source, contact us — we verify and update within 30 days.
Ready to create your next invoice?
Use AI drafting on the homepage or sign up for a free account with cloud save and monthly plan limits.