Entrepreneurship Statistics (2026): 65+ Data Points on Global Startups, Funding, Failure, and the Entrepreneur Behind the Business
There are approximately 665 million entrepreneurs worldwide — one in every eight working-age people on the planet is currently engaged in an entrepreneurial activity. In the United States alone, 6.6 million Americans started a new business in 2025, the highest figure since pre-pandemic baselines, driven significantly by immigrant entrepreneurs who are twice as likely to start businesses as native-born Americans. Global venture capital deployed $512.6 billion in 2025 — the second-highest annual total on record — with AI companies capturing more than half of all investment for the first time in history. We aggregated data from the Global Entrepreneurship Monitor (GEM) 2025/2026 Global Report, the Kauffman Foundation National Report on Early-Stage Entrepreneurship in the United States: 2025, the PitchBook-NVCA Q4 2025 Venture Monitor, the U.S. Census Bureau Business Formation Statistics 2024, the Startup Genome Global Startup Ecosystem Report 2025, the GEM 2024/2025 United States Report via Babson College, and dozens of other primary sources to build the most comprehensive entrepreneurship statistics reference available for 2026.
Try it on your next invoice
Draft from text or voice, edit every field, and export a PDF—free on the homepage.
Try AI invoiceKey Takeaways
- There are approximately 665 million entrepreneurs worldwide — roughly 1 in 8 working-age people is engaged in some form of entrepreneurial activity (GEM 2024/2025 Global Report).
- Approximately 6.6 million American adults started a new business in 2025 — a return to pre-pandemic formation levels, driven significantly by immigrant entrepreneurs (Kauffman Foundation, National Report on Early-Stage Entrepreneurship: 2025).
- U.S. Total Entrepreneurial Activity (TEA) returned to a historic high of 19% — nearly 1 in 5 American adults is actively starting or running a new business (GEM 2024/2025 United States Report, Babson College).
- Global venture capital deployed $512.6 billion in 2025 — the second-highest annual total on record; AI investment accounted for more than half of that total (PitchBook-NVCA Q4 2025 Global VC First Look).
- 1,705 unicorns exist globally as of March 2026, worth a combined $5.2 trillion; the aggregate value of U.S. unicorns alone stands at $4.3 trillion (PitchBook-NVCA Q4 2025 Venture Monitor).
- 77% of startups are initially funded by personal savings — only 0.05% of startups ever raise venture capital (Fundera, cited in YouStartups Startup Statistics 2026).
- 83.3% of new U.S. entrepreneurs in 2025 started by choice (opportunity-driven), not necessity — though this figure represents a significant decline from pre-2019 levels (Kauffman Foundation 2025).
- 90% of startups fail; the top causes are lack of market need (42%) and running out of cash (29%) (CB Insights Top Startup Failure Reasons, cited in LimelightDigital 2026).
- 28% of all new U.S. entrepreneurs are immigrants, despite immigrants comprising only 15% of the total population — and immigrant entrepreneurs employ 1 in 10 private-sector workers (Kauffman Foundation, cited in North American Community Hub 2025).
- 84% of early-stage entrepreneurs globally consider social and/or environmental impact in their business decisions (GEM 2025/2026 Global Report).
- The average age of peak entrepreneurial success is 42 years old — peak success consistently occurs in the 40s and 50s, not in the 20s as popular culture suggests (Podbase, citing MIT/Kauffman research, April 2026).
- The global startup ecosystem has an average annual growth rate of 21% (Global Startup Ecosystem Index 2025).
The Global Entrepreneurship Landscape
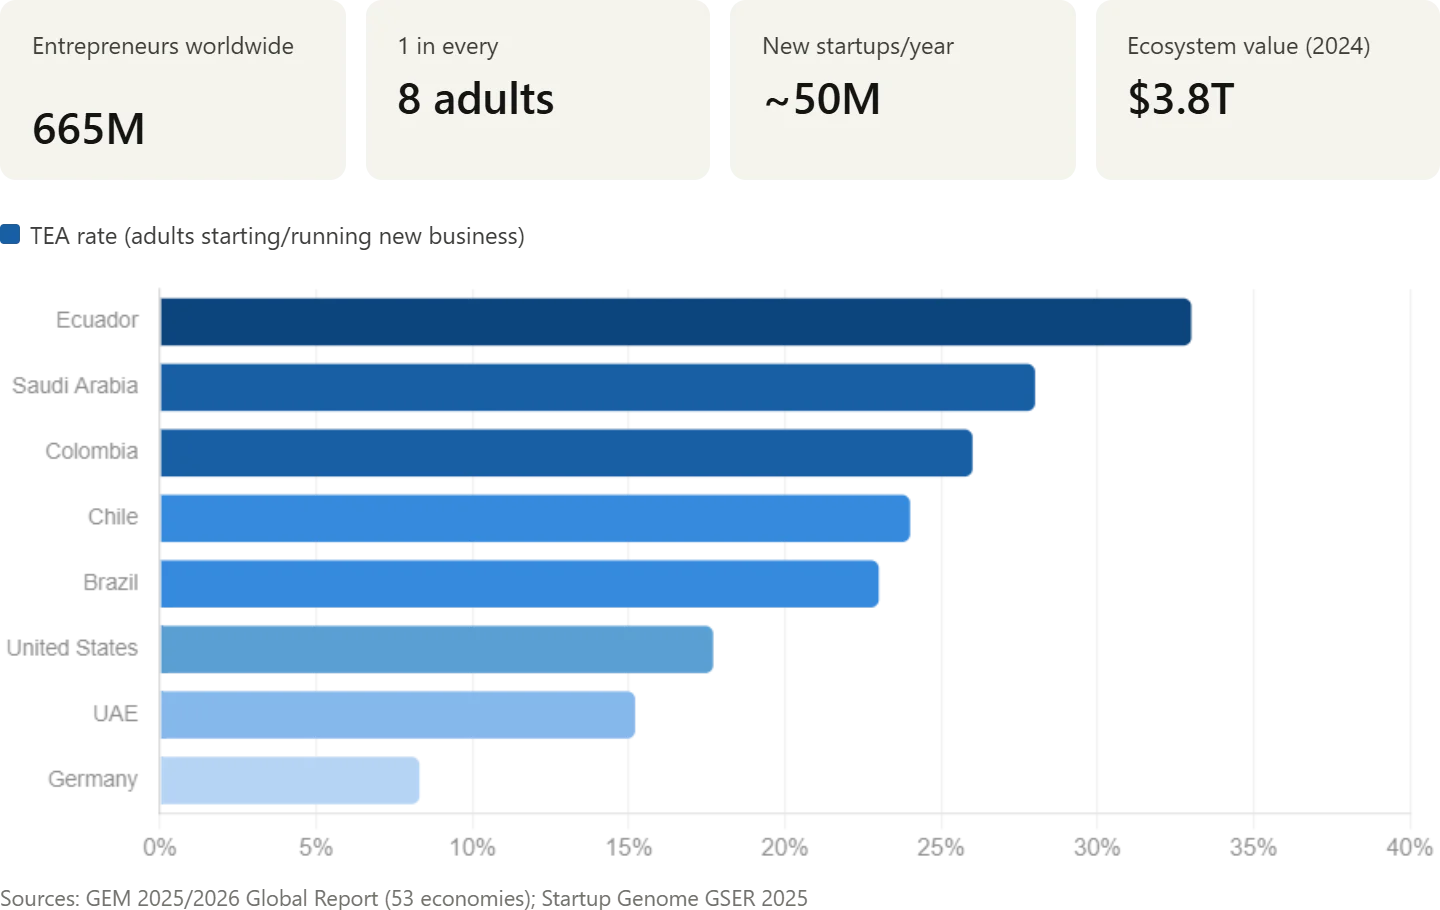
Entrepreneurship is genuinely global — and the geography is shifting. The United States remains the world's leading startup ecosystem, but its relative dominance is narrowing. The U.S. is still in the lead, but on a downward trend as emerging markets accelerate. Ecuador boasts the highest percentage of adults starting or running a business (33%) of any economy measured by GEM — a figure that reflects necessity-driven entrepreneurship in a lower-income economy. The U.S. TEA of 17.7% ranks 18th globally — strong but not dominant. The GEM 2025/2026 report draws on data from 53 participating economies, representing approximately 43% of the global population and 57% of global GDP, and shows that startup rates are at record levels in many regions. The single most consequential structural shift in 2025 is AI-enabled formation: first-time founders can now build, market, and invoice a product with tools that cost less than $100/month.
| Metric | Value | Source |
|---|---|---|
| Entrepreneurs worldwide | ~665 million (1 in 8 working-age adults) | GEM 2024/2025 Global Report |
| Global startup ecosystem annual growth rate | 21% | Global Startup Ecosystem Index 2025 |
| Global startup ecosystem total value (2024) | $3.8 trillion | Startup Genome, GSER 2025 |
| Total startups worldwide | ~150 million | Creatly / TechRT, citing GEM and Startup Ranking 2025 |
| New startups launched per year | ~50 million (~137,000/day) | TechRT, Startup Statistics 2026 |
| Country with highest adult startup activity rate | Ecuador (33% TEA) | GEM 2025/2026 Global Report |
| U.S. TEA ranking globally | 18th (17.7% TEA) | GEM 2025/2026 Global Report, via CAKE.com |
| UAE: ranked #1 National Entrepreneurship Context Index | 5th consecutive year | GEM 2025/2026 Global Report |
| Economies with gender parity in startup activity (middle-income) | 9 of 23 approaching parity | GEM 2025/2026 Global Report |
| Adults globally deterred by fear of failure | 2 in 5 (40%) | GEM 2025/2026 Global Report |
| Entrepreneurs who previously exited: likelihood of starting again | Higher than first-timers | GEM 2025/2026 Global Report |
Primary source: Global Entrepreneurship Monitor (GEM) 2025/2026 Global Report: "From Uncertainty to Opportunity". Now in its 27th year, GEM is the world's most comprehensive entrepreneurship study, covering 53 economies through nationally representative surveys. Unlike business registry data, GEM collects primary data directly from individuals.
U.S. Entrepreneurship: Formation, Activity, and Structure
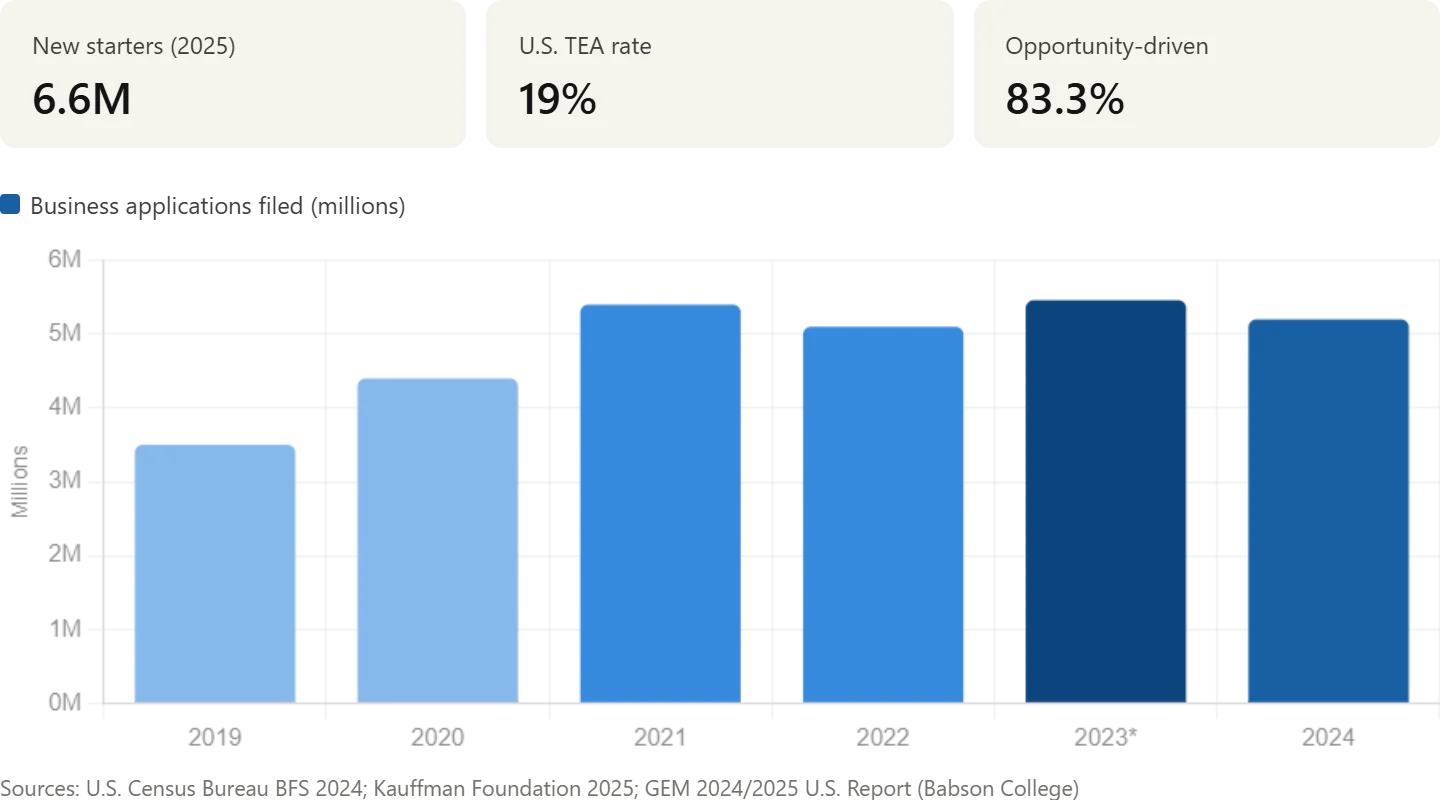
The Kauffman Foundation's 2025 National Report on Early-Stage Entrepreneurship — a 30-year longitudinal analysis — found that approximately 6.6 million American adults started a new business in 2025, a return to pre-pandemic formation levels driven in significant part by immigrant entrepreneurs. But the headline recovery figure carries a caveat: a larger share of new entrepreneurs are still launching out of necessity rather than opportunity compared to 2019 levels, and the gender disparity in new business formation has remained nearly unchanged since 1996. The U.S. TEA of 19% means nearly 1 in 5 American adults is starting or running a new business — a figure that encompasses everything from a freelance graphic designer to a Series A-funded SaaS company.
| Metric | Value | Source |
|---|---|---|
| New U.S. business starters (2025) | 6.6 million adults | Kauffman Foundation, National Report on Early-Stage Entrepreneurship: 2025 |
| U.S. Total Entrepreneurial Activity (TEA) | 19% (historic high, tied with 2022) | GEM 2024/2025 U.S. Report, Babson College |
| U.S. Established Business Ownership (EBO) rate | 6.6% (second consecutive year of decline, down from 9.2%) | GEM 2024/2025 U.S. Report, Babson College |
| New business applications filed (2024) | 5.2 million | U.S. Census Bureau, Business Formation Statistics 2024 |
| Record U.S. business applications (2023) | 5.46 million (all-time record) | U.S. Census Bureau, Business Formation Statistics 2023 |
| Opportunity-driven new entrepreneurs (2025) | 83.3% (down from pre-2019 levels) | Kauffman Foundation, 2025 National Report |
| U.S. startups by count | 1.56 million (leading globally) | Startup Ranking 2025, cited in YouStartups |
| U.S. adults who perceive good startup opportunities nearby | ~73% | GEM 2024/2025 U.S. Report, cited in Plaky 2026 |
| U.S. adults who believe they have the skills to start a business | ~76% | GEM 2024/2025 U.S. Report, cited in Plaky 2026 |
| Entrepreneurs citing job scarcity as a motive (upward trend since 2022) | Over two-thirds | GEM 2024/2025 U.S. Report, Babson College |
Primary sources: Kauffman Foundation, National Report on Early-Stage Entrepreneurship in the United States: 2025 (30-year longitudinal analysis using the Kauffman Early-Stage Entrepreneurship Index across four indicators) and GEM 2024/2025 United States Report (led by Babson College Professor Donna Kelley, 2025 publication, nationally representative survey).
Who Entrepreneurs Are: Demographics and Motivations
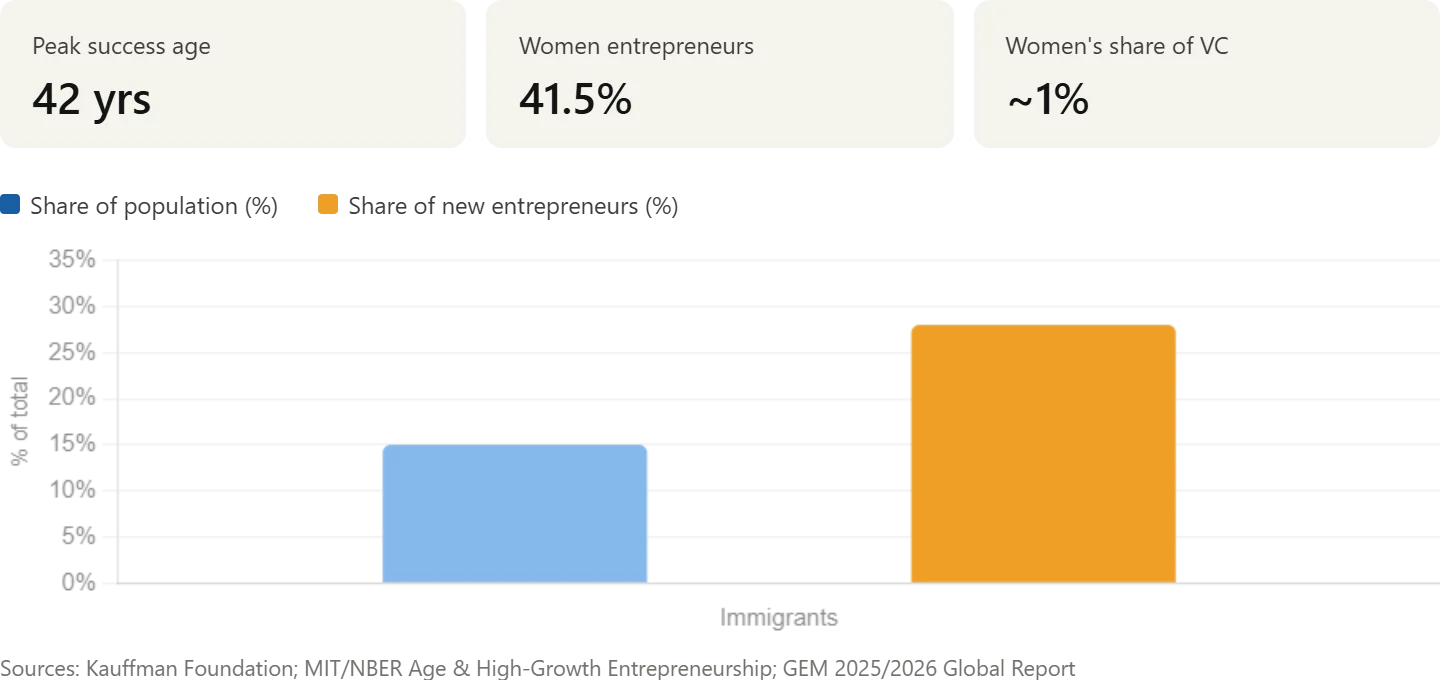
The popular image of the 22-year-old founder dropping out of Stanford to build a unicorn is statistically false. The average age of peak entrepreneurial success is 42 years old — peak success consistently arrives in the 40s and 50s. Research by MIT economists published through the NBER found that a 50-year-old founder is nearly twice as likely to build a top-growth company as a 30-year-old. The gender gap in entrepreneurship is narrowing globally — 9 of 23 middle-income economies have reached or are approaching gender parity in startup activity — but persists in high-income economies, including the U.S. The gender disparity in new U.S. business formation has remained nearly unchanged since 1996. The most structurally significant demographic finding in 2025 is the immigrant entrepreneur data: immigrants are twice as likely to start businesses as native-born Americans, and their overrepresentation in high-growth, job-creating ventures is disproportionate to their share of the population.
| Metric | Value | Source |
|---|---|---|
| Average age of peak entrepreneurial success | 42 years old | MIT/NBER, Age and High-Growth Entrepreneurship, cited in Podbase Apr 2026 |
| Immigrant share of new U.S. entrepreneurs | 28% (vs. 15% of total population) | Kauffman Foundation, cited in North American Community Hub 2025 |
| Immigrants' likelihood of starting a U.S. business vs. native-born | 2x more likely | Kauffman Foundation / NBER |
| Women as share of U.S. entrepreneurs | ~41.5% | Zippia, cited in LimelightDigital 2026 |
| Women-founded startup teams receiving VC funding | ~1% of total VC | Zippia, cited in LimelightDigital 2026 |
| Entrepreneurs with a bachelor's degree | ~62% (varies: 44% hold a 4-year degree per Podbase) | Hostinger citing GEM, Jan 2026 |
| Top motivation for starting a business | Lifestyle/career change (70%) | Podbase, citing Guidant Financial 2025 |
| Entrepreneurs considering social/environmental impact | 84% of early-stage entrepreneurs globally | GEM 2025/2026 Global Report |
| Immigrant-founded U.S. unicorns (share) | 44 of 87 top VC-backed unicorns | NBER / Kauffman, cited in North American Community Hub 2025 |
| Immigrant-led firms: likelihood of exporting vs. native-owned | 60% more likely to export | NBER / Kauffman, cited in North American Community Hub 2025 |
Primary sources: MIT/NBER study on Age and High-Growth Entrepreneurship (Azoulay et al., 2020 — most recent available). GEM 2025/2026 Global Report for motivation and gender parity data. Kauffman Foundation immigrant entrepreneurship research for formation rates.
eInvoiceGenerator's multi-client invoicing and bulk invoice generator are specifically built for solo and early-stage entrepreneurs who are their own finance department — eliminating the invoicing admin that consumes 25% of solo founder working time.
Startup Failure Rates and Causes
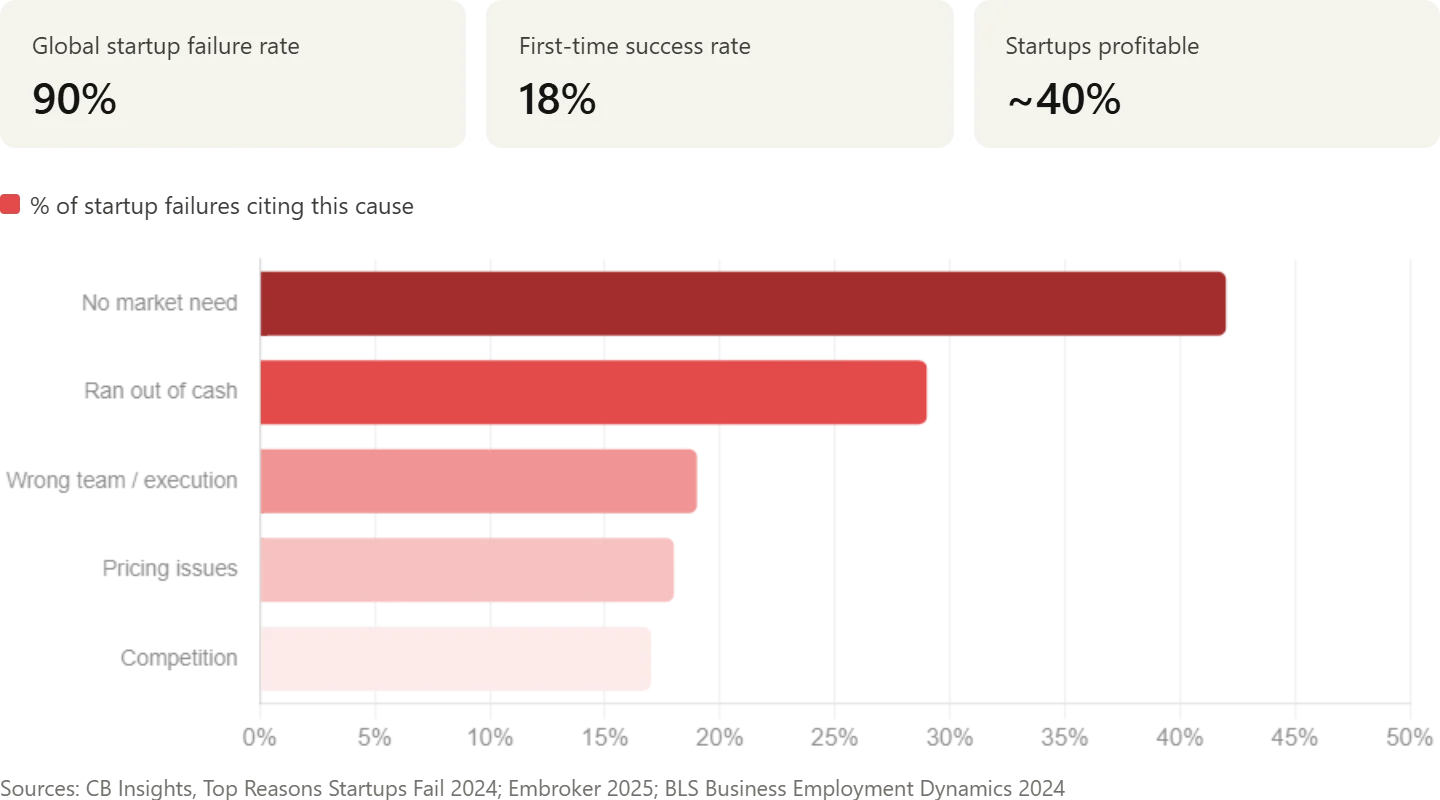
90% of startups fail; the top causes are lack of market need (42%), running out of cash (29%), and weak team or execution (19%). The 90% figure is a startup-specific figure — it should not be conflated with the BLS small business survival data (which shows 20.4% failure in year one). Startups are a subset of small businesses: high-growth-intent, typically venture-seeking ventures with a different risk profile from service businesses and sole proprietors. The cash failure cause (29%) connects directly to invoice management: closures in the U.S. are rising due to unprofitability and financing issues, and only 6.6% of Americans run mature businesses — below the average of 32 high-income economies. First-time founders have an 18% success rate; founders who previously failed have a 20% success rate — experience adds only marginally more odds than a coin flip.
| Metric | Value | Source |
|---|---|---|
| Global startup failure rate | ~90% | CB Insights, cited in DemandSage 2026 |
| Top failure cause: no market need | 42% | CB Insights, Top Reasons Startups Fail, 2024 |
| Top failure cause: ran out of cash | 29% | CB Insights, Top Reasons Startups Fail, 2024 |
| Top failure cause: wrong team / execution | 19% | CB Insights, Top Reasons Startups Fail, 2024 |
| First-time founder success rate | 18% | Embroker, cited in DemandSage 2026 |
| Previously failed founder success rate | 20% | Embroker, cited in DemandSage 2026 |
| Startups that are profitable | ~40% | LimelightDigital, citing industry benchmarks 2026 |
| Startups that break even | ~33% | LimelightDigital, citing industry benchmarks 2026 |
| Startups operating at a loss | ~33% | LimelightDigital, citing industry benchmarks 2026 |
| U.S. businesses surviving to year 10 (all small businesses) | 34.7% | Bureau of Labor Statistics, BED 2024 |
| Entrepreneurs who regret not seeking mentorship earlier | Majority of failed founders | GEM / Hostinger citing GEM, Jan 2026 |
Primary source: CB Insights, The Top 12 Reasons Startups Fail (2024 update, post-mortem analysis of 100+ startup failures). Note: 90% failure rate applies specifically to venture-type startups. The BLS survival figure for all new U.S. businesses is 20.4% failure in year one — a distinctly different population.
Startup Funding: Venture Capital and Bootstrapping Reality
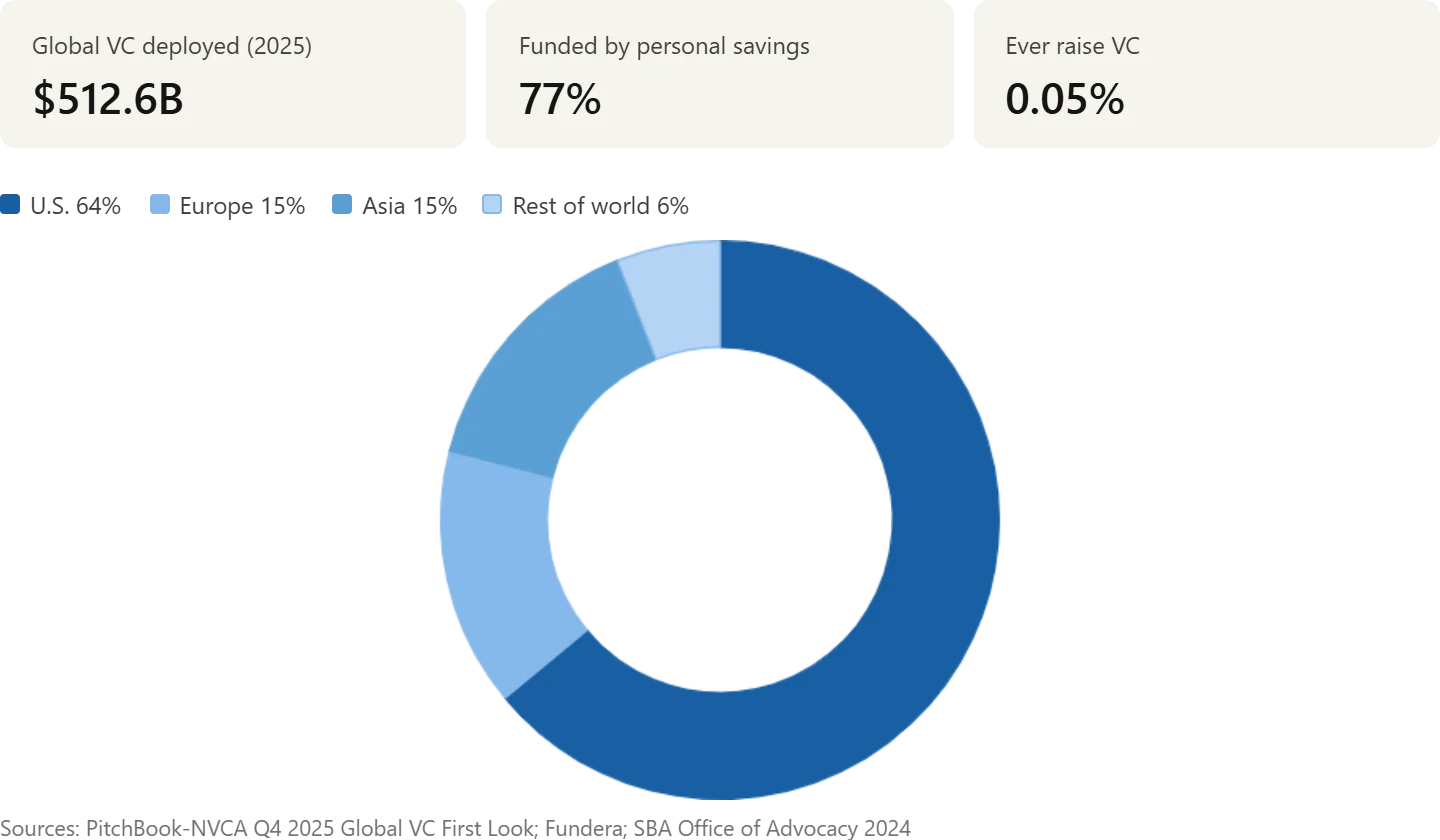
The global VC market deployed $512.6 billion in 2025 — falling behind only 2021 and 2022 in terms of total deal value. However, the top-line figure was more concentrated than ever before, with AI investment accounting for more than half of that total and the U.S. leading the way, representing a full two-thirds of VC investment. But the headline VC figures are structurally misleading for most founders. Only 0.05% of startups ever raise venture capital. The remaining 99.95% bootstrap, use credit cards, borrow from family, or seek small business loans. 77% of startups are initially funded by personal savings. The average cost of starting a business is $40,000 — and 64% of founders start with $10,000 or less. The gap between what gets covered in the media and what actually funds the entrepreneurial economy could not be wider.
| Metric | Value | Source |
|---|---|---|
| Global VC deployed (2025) | $512.6 billion (2nd highest on record) | PitchBook-NVCA Q4 2025 Global VC First Look |
| AI share of global VC (2025) | 50%+ ($211 billion) | PitchBook-NVCA Q4 2025 Venture Monitor |
| U.S. share of global VC (2025) | 64% ($274 billion) | PitchBook-NVCA Q4 2025 Venture Monitor |
| YoY growth in global VC (2025 vs. 2024) | +30% (from $328B to $425B deal count basis) | YouStartups, Startup Statistics 2026 |
| U.S. VC new fund commitments (2025) | $66.1 billion (lowest since 2018) | PitchBook-NVCA Q4 2025 Venture Monitor |
| Average U.S. seed round (2025) | $2.2 million | Embroker / TechRT, citing PitchBook 2025 |
| Average Series A round (global) | $15–20 million | TechRT, Startup Statistics 2026 |
| Startups funded by personal savings | 77% | Fundera, cited in YouStartups 2026 |
| Startups that ever raise VC | 0.05% | Fundera, cited in DemandSage 2026 |
| Average cost of starting a business | $40,000 | Embroker, cited in DemandSage 2026 |
| Founders starting with $10,000 or less | 64% | SBA Office of Advocacy, 2024 |
| VC concentration: share of 2025 deal value in top 0.05% of deals | ~50% | PitchBook-NVCA Q4 2025 Venture Monitor |
Primary source: PitchBook-NVCA Q4 2025 Global VC First Look (published February 2026). The most authoritative global VC dataset. Note: half of all venture dollars went into just 0.05% of deals in 2025 — the "VC boom" is a story about a tiny number of very large rounds, not broad-based founder financing.
The Unicorn Economy: High-Growth Startups and Valuations
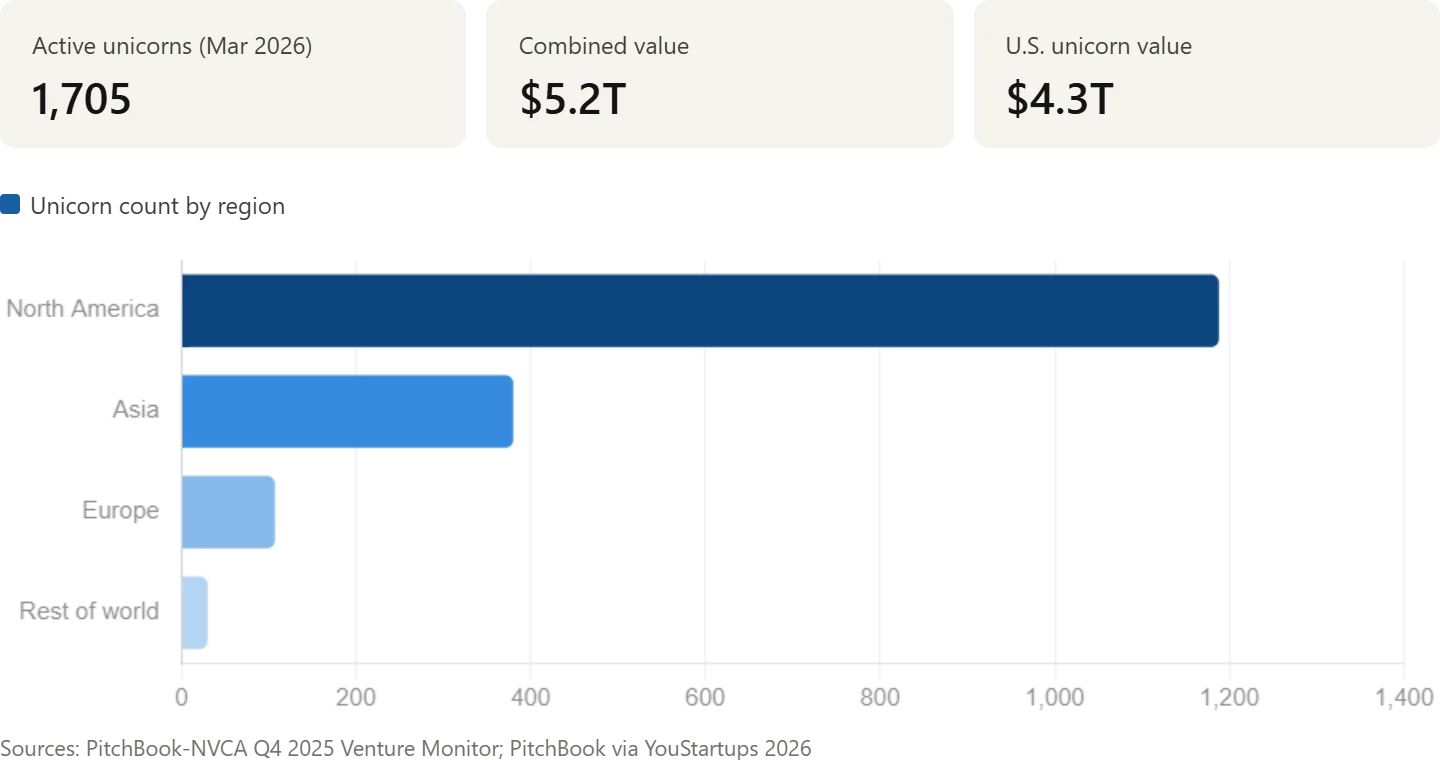
1,705 unicorns exist globally as of March 2026, worth a combined $5.2 trillion. The aggregate value of U.S. unicorns alone stands at $4.3 trillion — enormous growth over the past year driven by OpenAI, SpaceX, xAI, Anthropic, and others. The unicorn economy is simultaneously a data point about innovation and a potential distortion of entrepreneurship narratives. Less than 0.1% of startups ever achieve unicorn status. But the companies that do are now staying private longer, creating a private market that rivals the public equity market in scale. IPOs from SpaceX, OpenAI, and Anthropic alone could generate nearly $2.5 trillion in exit value — more than all VC-backed IPOs in this century combined.
| Metric | Value | Source |
|---|---|---|
| Active unicorns globally (March 2026) | 1,705 | PitchBook, cited in YouStartups 2026 |
| Combined value of global unicorns | $5.2 trillion | PitchBook, cited in YouStartups 2026 |
| U.S. unicorn aggregate value | $4.3 trillion | PitchBook-NVCA Q4 2025 Venture Monitor |
| U.S. unicorns by count | ~800+ | TechRT, Startup Statistics 2026 |
| North America unicorns by count | 1,188 of 1,619 tracked by Pitchbook | PitchBook via LimelightDigital 2026 |
| Highest-valued private company globally (2026) | SpaceX ($1.25 trillion post xAI merger) | YouStartups, citing PitchBook 2026 |
| U.S. unicorns with at least one immigrant co-founder | More than half | NBER / Kauffman Foundation |
| Potential IPO exit value: SpaceX + OpenAI + Anthropic | ~$2.5 trillion | PitchBook-NVCA Q4 2025 Venture Monitor |
| VC-backed private companies globally | 60,000+ | PitchBook-NVCA Q3 2025 Venture Monitor |
| Global VC exit value (2025) | $549.2 billion (up $200B+ over 2024) | PitchBook Q4 2025 Global VC First Look |
Entrepreneur Mindset, Challenges, and Wellbeing
The mental health data on entrepreneurship is among the most under-reported in the space. 46% of entrepreneurs struggle with high stress, according to a 2025 University of New Hampshire survey — a figure that aligns with broader research showing entrepreneur burnout rates substantially higher than employed professionals. The stress source is concrete: it is cash flow, late payments, solo decision-making, and the absence of a financial safety net that characterizes the majority of founder experiences — not abstract market competition. Yet entrepreneurship retention is high: GEM consistently finds that people who have exited a failed business are more likely to start again than the general adult population. The entrepreneur identity, once formed, is remarkably persistent.
| Metric | Value | Source |
|---|---|---|
| Entrepreneurs reporting high stress | 46% | University of New Hampshire survey, 2025, cited in Flowlu 2026 |
| Small business owners losing sleep over financial stress | 2 in 3 (66%+) | Bluevine Financial Stress Survey, May 2026 |
| Owners citing cash gap as top stressor | 41% | Bluevine Financial Stress Survey, May 2026 |
| Owners who reduced or skipped their own pay (past year) | 62% | Bluevine Financial Stress Survey, May 2026 |
| Previously failed entrepreneurs: likelihood of starting again | Higher than general adult population | GEM 2025/2026 Global Report |
| Adults who perceive entrepreneurship as a good career choice (U.S.) | ~72% | GEM 2024/2025 U.S. Report, cited in Plaky 2026 |
| Adults globally who see entrepreneurship positively | 70%+ in most high-income economies | GEM 2025/2026 Global Report |
| Entrepreneurs working 50+ hours/week | ~33% | Gallup, cited in Hostinger Jan 2026 |
| SMB owners projecting growth in 2026 | 94% | OnDeck/Ocrolus Q4 2025, cited in Wave Connect |
| Entrepreneurs who say business ownership is "worth it" despite challenges | 75% | Bluevine, Expectations vs. Reality Report, April 2026 |
Primary sources: GEM 2025/2026 Global Report and Bluevine Financial Stress Survey, May 2026. The Bluevine surveys are the most granular recent data on the personal financial experience of small business owners.
eInvoiceGenerator's AI invoice generator and dashboard are built to address the #1 stressor directly — closing the gap between completing work and receiving payment, so founders spend less time on admin and more time building.
Entrepreneurship by the Numbers: Summary Table
| Theme | Metric | Value | Source |
|---|---|---|---|
| Global Scale | Entrepreneurs worldwide | ~665 million | GEM 2024/2025 Global Report |
| Global Scale | Global startup ecosystem value | $3.8 trillion | Startup Genome GSER 2025 |
| Global Scale | Annual startup growth rate | 21% | GSEI 2025 |
| Global Scale | New startups launched per year | ~50 million | TechRT 2026 |
| U.S. Activity | New U.S. business starters (2025) | 6.6 million | Kauffman Foundation 2025 |
| U.S. Activity | U.S. TEA rate (2025) | 19% (historic high) | GEM 2024/2025 U.S. Report |
| U.S. Activity | Business applications filed (2024) | 5.2 million | Census Bureau BFS 2024 |
| Demographics | Peak founder success age | 42 years | MIT/NBER, cited in Podbase 2026 |
| Demographics | Immigrant share of new U.S. entrepreneurs | 28% | Kauffman Foundation |
| Demographics | Women's share of VC funding | ~1% | Zippia via LimelightDigital 2026 |
| Demographics | Entrepreneurs motivated by lifestyle/career change | 70% | Guidant Financial 2025 |
| Failure | Global startup failure rate | 90% | CB Insights 2024 |
| Failure | Failure: no market need | 42% | CB Insights 2024 |
| Failure | Failure: ran out of cash | 29% | CB Insights 2024 |
| Failure | First-time founder success rate | 18% | Embroker 2025 |
| Funding | Global VC deployed (2025) | $512.6 billion | PitchBook-NVCA Q4 2025 |
| Funding | AI share of global VC (2025) | 50%+ | PitchBook-NVCA Q4 2025 |
| Funding | Startups funded by personal savings | 77% | Fundera via YouStartups 2026 |
| Funding | Startups that ever raise VC | 0.05% | Fundera via DemandSage 2026 |
| Unicorns | Active unicorns globally (Mar 2026) | 1,705 | PitchBook via YouStartups |
| Unicorns | U.S. unicorn aggregate value | $4.3 trillion | PitchBook-NVCA Q4 2025 |
| Wellbeing | Entrepreneurs with high stress | 46% | UNH 2025 via Flowlu 2026 |
| Wellbeing | SMB owners losing sleep over finances | 2 in 3 | Bluevine May 2026 |
| Wellbeing | Owners who say it's "worth it" | 75% | Bluevine April 2026 |
Methodology and Sources
This article was compiled from primary surveys, government datasets, institutional research reports, and Tier 2 aggregators that explicitly disclose their underlying source. No statistics were reproduced from secondary blogs without tracing to the original named study.
Primary Sources Used:
- Global Entrepreneurship Monitor (GEM) — 2025/2026 Global Report: "From Uncertainty to Opportunity" (February 2026). 27th annual edition. 53 participating economies, nationally representative surveys. The world's most comprehensive entrepreneurship study.
- Global Entrepreneurship Monitor (GEM) — 2024/2025 United States Report (March 2026). Led by Babson College Professor Donna Kelley. Primary data source for U.S. TEA, EBO, motivations, and demographics.
- Kauffman Foundation — National Report on Early-Stage Entrepreneurship in the United States: 2025 (May 2026). 30-year longitudinal analysis using the Kauffman Early-Stage Entrepreneurship Index.
- Kauffman Foundation — Immigrant Entrepreneurship Research. Multiple studies on immigrant formation rates and economic contribution.
- PitchBook / NVCA — Q4 2025 Global VC First Look (February 2026). Authoritative global VC dataset.
- PitchBook / NVCA — Q4 2025 PitchBook-NVCA Venture Monitor (February 2026). Definitive review of the U.S. venture capital ecosystem.
- U.S. Census Bureau — Business Formation Statistics 2024. High-frequency weekly data on new business applications.
- Bureau of Labor Statistics — Business Employment Dynamics 2024. Business survival rates by cohort and industry.
- CB Insights — The Top 12 Reasons Startups Fail (2024 update). Post-mortem analysis of 100+ startup failures.
- Startup Genome — Global Startup Ecosystem Report 2025. Annual global ecosystem index and valuation data.
- Azoulay, P., Jones, B.F., Kim, J.D., Miranda, J. — "Age and High-Growth Entrepreneurship" (American Economic Review: Insights, 2020). NBER. Most recent available primary research on founder age and success.
- Bluevine — Small Business Expectations vs. Reality Report (April 2026) and Financial Stress Survey (May 2026).
- OnDeck — Small Business Trends Report, Q4 2025 / Q1 2026. Quarterly Ocrolus cash flow platform data.
- SBA Office of Advocacy — FAQ About Small Business 2026. Official U.S. small business headline figures.
Last updated: May 2026. We update this page quarterly to reflect new GEM reports, PitchBook VC data, and Kauffman Foundation releases.
All statistics are cited inline at point of use. If you find an updated or conflicting primary source, contact us — we verify and update within 30 days.
Ready to create your next invoice?
Use AI drafting on the homepage or sign up for a free account with cloud save and monthly plan limits.